

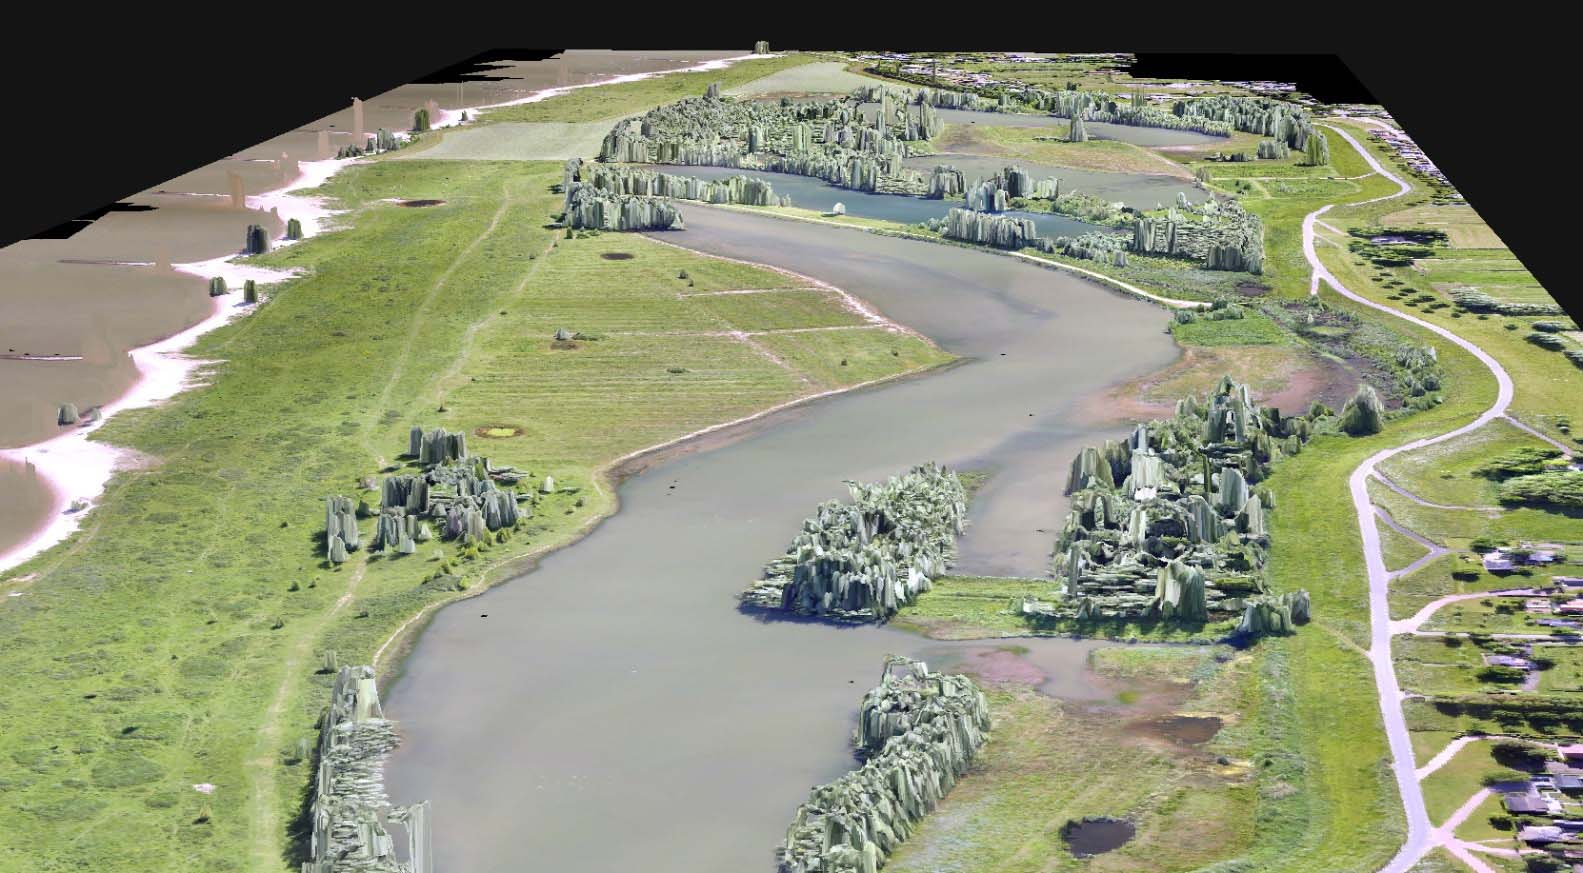
True color point cloud of the Breemwaard floodplain that is located on the southern bank of the Dutch river Waal (Source: Wimala van Iersel).
Innovative components
Understanding the seasonal variation of low floodplain vegetation (from 0.5 up to 3 m high) is crucial for flood modeling, ecosystem services, and ecological applications. However, changes at the centimeter scale are not easy to monitor with traditional aerial photos. At a plot scale, we tested the performance of the so-called unmanned airborne vehicle or drones to derive a digital terrain level and to record both the vegetation growth and greenness changes over a growing season (see right figure). As a reference for the novel imagery derived from the drone sensor, we manually took a measure of vegetation height for every plot and seasonal period. Thereby, we processed the imagery into point clouds with color attributes for each time step. From the differences between the point clouds, we calculated per plot the terrain and vegetation height as well as vegetation greenness.
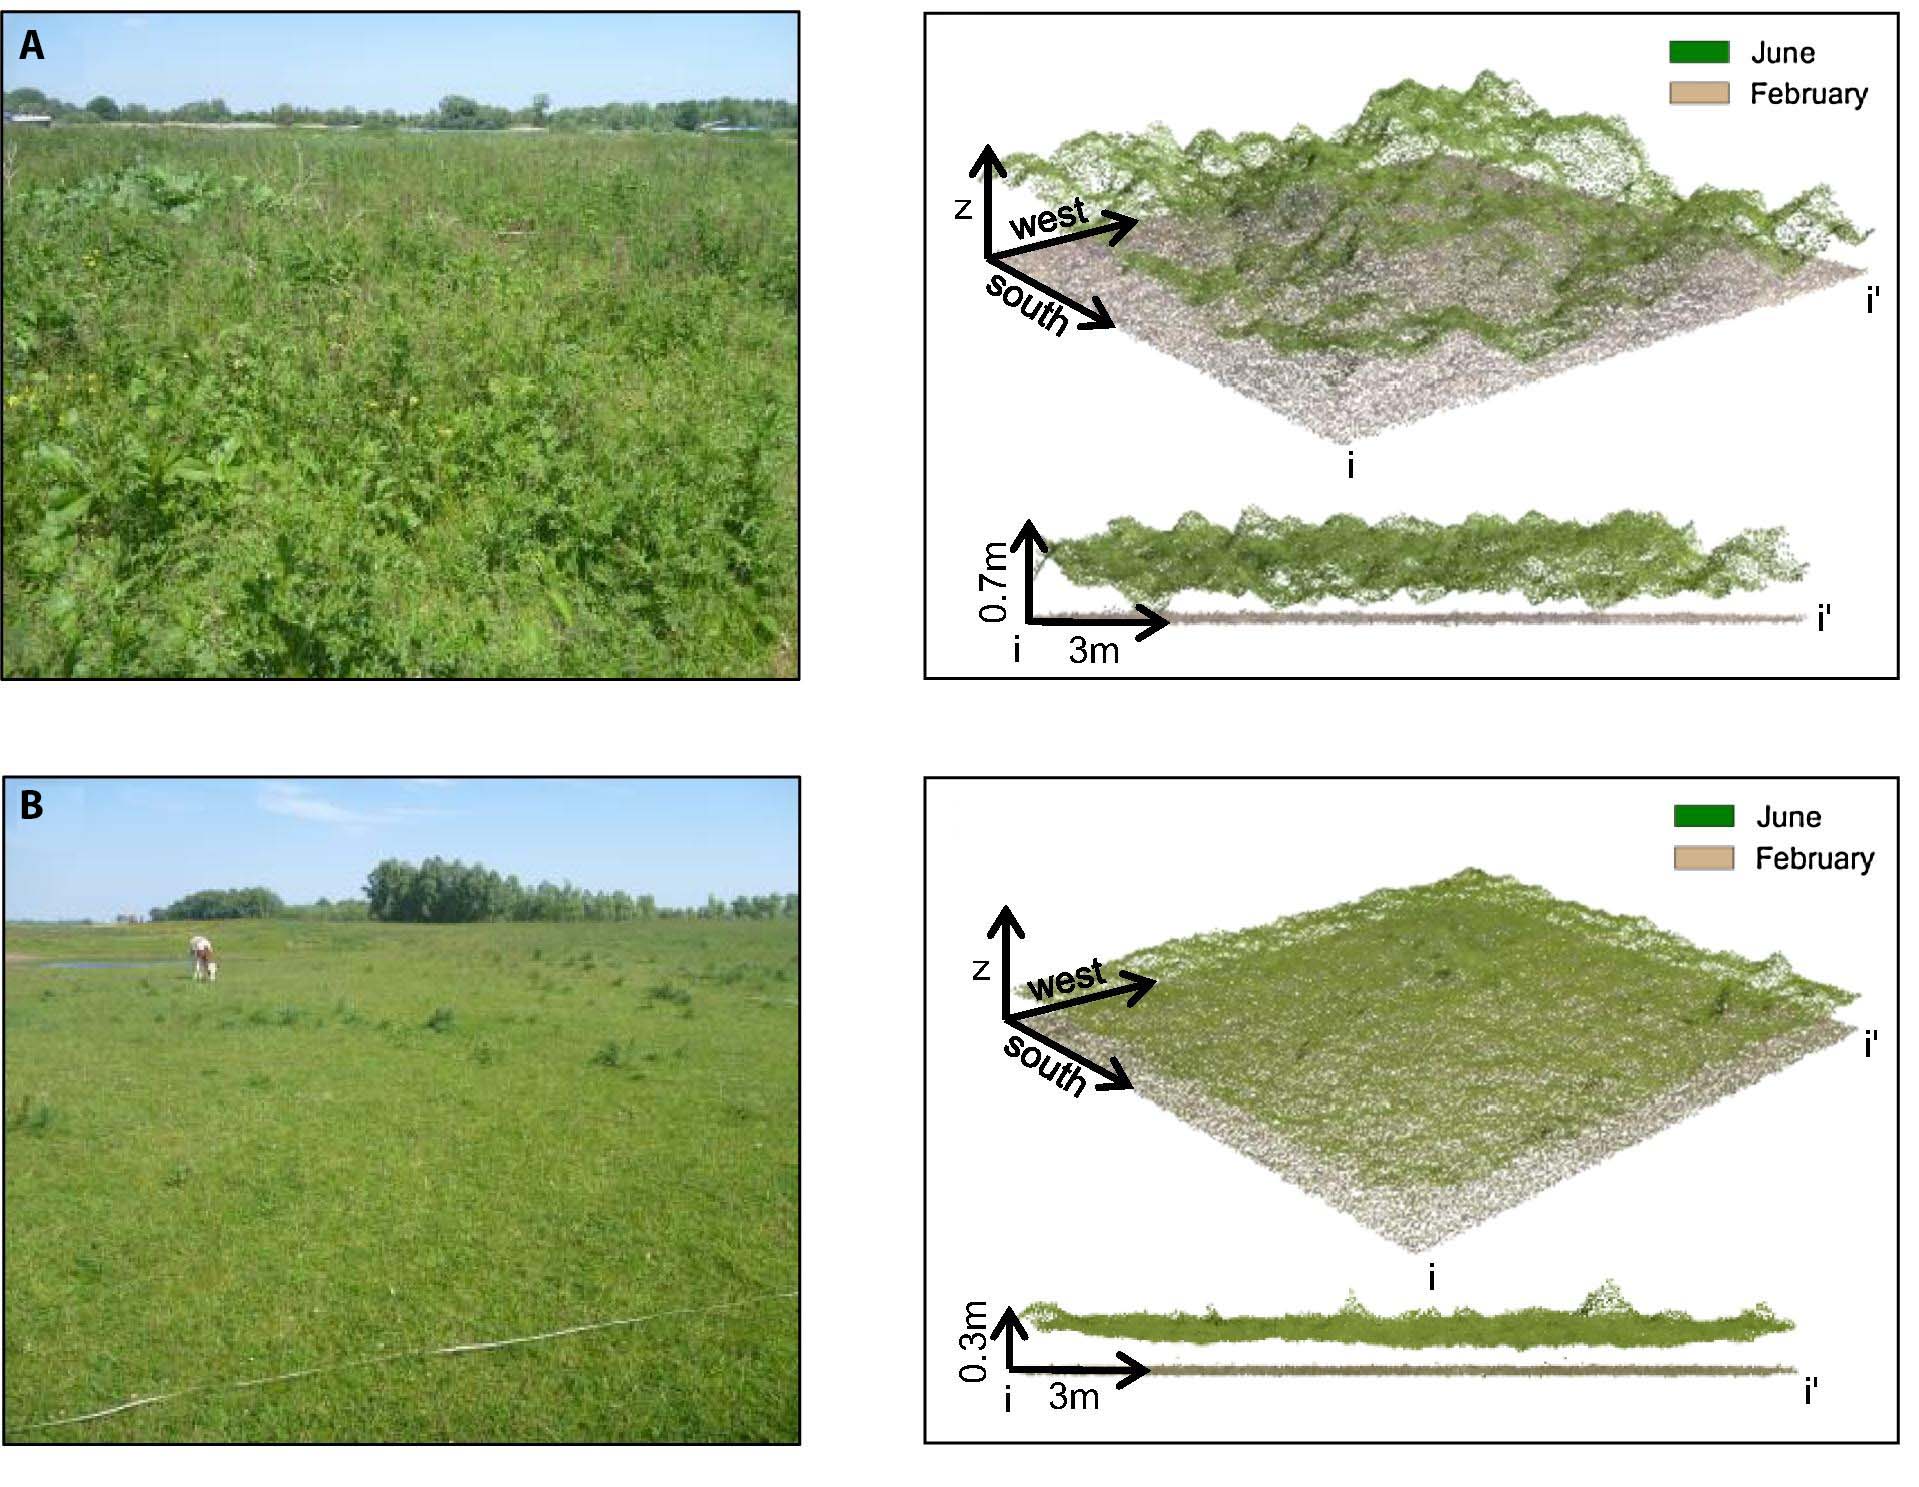
Field photographs of June and examples of true colour point clouds of a high herbaceous plot (A) and a natural grassland plot (B) of 15 × 15 m. (Source: Adapted from van Iersel et al. 2018)
Findings and implications to practice
We studied a 116 ha floodplain, known as Breemwaard that is located on the southern bank of the Dutch river Waal in the (see figure above). Simultaneously with each drone survey, we collected data on vegetation height in 28 plot for six times over a growing season (February, April, June, September, November 2015 and January 2016). Results show high potential for increasing the classification accuracy of low floodplain vegetation (see right figure).
Moreover, the accuracy of the digital terrain model derived from the drone survey varied over a year and was most accurate during winter. The vegetation height was derived in a simple way (via linear regression) from the multitemporal imagery. We also identified temporal greenness and height profiles: The growth of herbaceous vegetation (0.5m up to 2.5m) follows a loop according to the seasonal stage whereas such loop was not clearly identified in grassland vegetation (maximum height of 0.5m).
Related Content
Publication
- van Iersel, W.K., Straatsma, M., Addink, E., & Middelkoop, H. (2018). Monitoring height and greenness of non-woody floodplain vegetation with UAV time series. ISPRS Journal of Photogrammetry and Remote Sensing, 141, 112–123. https://doi.org/10.1016/j.isprsjprs.2018.04.011.
- van Iersel, W.K., Straatsma, M.W., Addink, E.A. & Middelkoop, H. (2016). Monitoring phenology of floodplain grassland and herbaceous vegetation with UAV imagery. In XXIII ISPRS Congress, Commission VII, 12–19 July 2016, Prague, Czech Republic (Vol. 41, pp. 569-571). International Society for Photogrammetry and Remote Sensing.
- If interested, here is the full list of related conference abstracts related to this project.
Dataset upon request
The source data behind this publication is available upon request according to the description of the supplementary material.
Last modified: 12/05/2019