

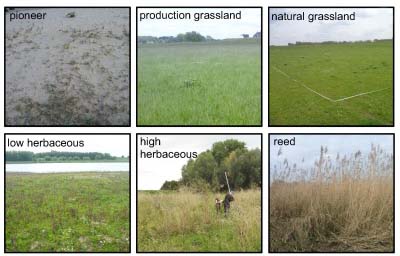
Field impressions of typical vegetation in the study area (Source: Adapted from van Iersel et al, 2018)
Innovative components
To our knowledge, this is the first study using time series imagery from the so-called unmanned airborne vehicle or drones to classify low vegetation at a floodplain scale. We used data collected from a seasonal survey in the Breemwaard floodplain of 116 ha along the Dutch river Waal. We identified several vegetation classes within the typical grassland and herbaceous vegetation (see right figure) with a classification accuracy of more than 90%. As compared to the classification accuracy with traditional aerial imagery (less than 58% for grassland and 87% for herbaceous), these high accuracies are because (1) the classification was not only based on the vegetation height of the pixel itself but also its surrounding pixels; and (2) the powerful classification method that we used for the analysis.
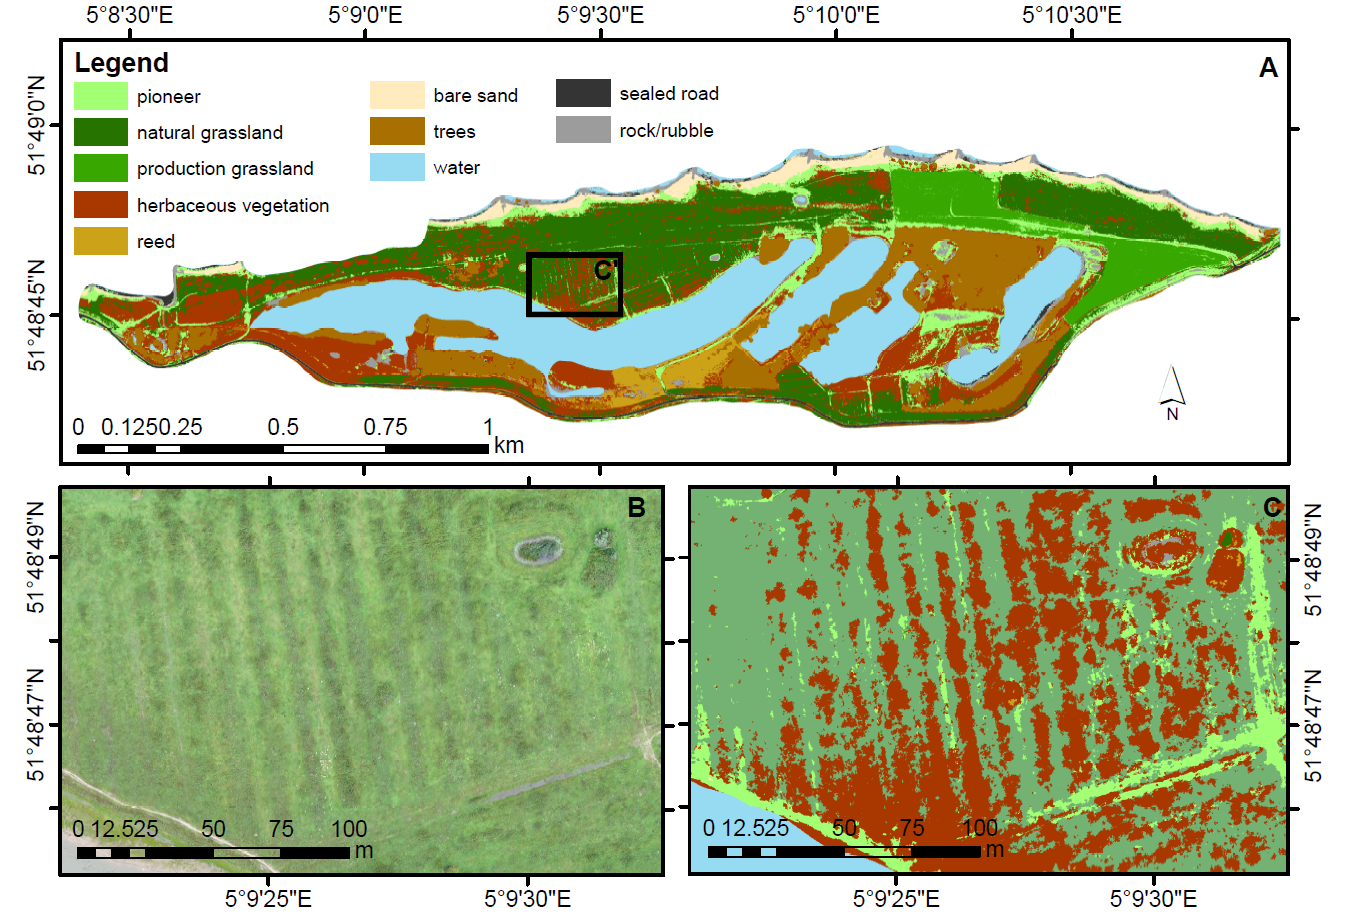
Classified land cover map of the Breemwaard floodplain (Source : van Iersel et al. 2018). Cilck on the image to enlarge view.
Findings and implications to practice
Using imagery of two or more time steps over a growing season compared with a single time step increased the classification accuracies from 96.9% to 99.3%. Vegetation classes based on the imagery for all the six times over the growing season (February, April, June, September, November 2015 and January 2016) did not necessarily have the highest accuracies. Instead, we found higher accuracies when combining the imagery of June and September. June was the moment of maximum vegetation greenness while in September, most vegetation was at its maximum height. For classes that are relatively stable over time (non-vegetated land cover), it may be beneficial to use a different type of sensor. For detailed low floodplain vegetation maps (see right figure), our method is a practical solution for monitoring areas of a few kilometers. The same method can be used for large-scale monitoring of floodplains, but with data from airborne platforms covering larger extents.
Related Content
Publication open access
- van Iersel, W.K.; Straatsma, M.W.; Middelkoop, H.; Addink, E. (2018) Multitemporal classification of river floodplain vegetation using time series of UAV images. Remote Sensing, 10(7), 1144. https://doi.org/10.3390/rs10071144.
- van Iersel, W.K.; Straatsma, M.W.; Addink, E.A.; Middelkoop, H. (2016) River floodplain vegetation classification using multi-temporal high-resolution colour infrared UAV imagery. GEOBIA 2016 : Solutions and Synergies., 14 September 2016 – 16 September 2016, University of Twente Faculty of Geo-Information and Earth Observation (ITC) (Part of book, conference).
- If interested, here is the full list of related conference abstracts related to this project.
Dataset upon request
The source data behind this publication is available upon request according to the description of the supplementary material.
Related outputs
Monitoring floodplain vegetation change at river-reach scale
A method to quickly detect where floodplain vegetation changes occur and to which vegetation class did they change.
12/05/2019 by Wimala van Iersel et al.
![]()
Contains: Publication
Monitoring height and greenness of low floodplain vegetation with a time series of drone images
We identified at a plot scale the seasonal changes in the terrain, vegetation height, and greenness in a simple way.
30/04/2018 by Wimala van Iersel et al.
![]()
Contains: Dataset upon request Publication open access
Last modified: 03/06/2019